
Monitoring network activity is no longer just a task for large enterprises. Even small offices, co-working spaces, schools, hospitality networks, and home labs need to understand how traffic flows, which apps consume the most bandwidth, and whether users are slowing down the network. Ubiquiti’s UniFi ecosystem has become a leading choice for these environments because it combines a cloud-managed platform with powerful hardware and analytics.
If you want to understand how applications, devices, and VLANs consume bandwidth, detect anomalies, and troubleshoot congestion, learning how to Monitor Network Traffic in UniFi is essential. This deep dive breaks down the tools, dashboards, features, policies, and limitations of UniFi traffic monitoring, along with practical tips you can apply immediately.
Why Monitoring Traffic Matters in Modern Networks
Before exploring how to Monitor Network Traffic in UniFi, it helps to understand why traffic analytics are critical.
Network monitoring allows you to:
- Identify high-bandwidth users, apps, or devices
- Detect misconfigurations causing congestion
- Analyze trends across wired and wireless networks
- Troubleshoot slowness and packet loss
- Implement QoS or bandwidth shaping policies
- Detect abnormal or suspicious activity
- Improve user experience by eliminating bottlenecks
Modern networks are increasingly wireless, multi-tenant, and application-intensive. Without visibility, you are essentially operating blind. UniFi offers multiple ways to get that visibility, whether you run UniFi OS Cloud, UniFi Network, or a self-hosted controller.
Understanding UniFi Traffic Analytics Architecture
UniFi processes traffic at several levels depending on your hardware:
- Gateway-level (UDM, UXG, UDR, etc.)
- Switch-level (USW series)
- Access point-level (U6, U7, AC series)
However, the depth of visibility largely depends on the gateway, because it sees all traffic entering or leaving the network. If you have switches and access points but no UniFi gateway, the controller can only provide limited, interface-level statistics—not full traffic analytics.
Key takeaway:
For full monitoring and deep analytics, a UniFi gateway is required.
Main Tools for Monitoring Network Traffic in UniFi
There are multiple dashboards designed to help you Monitor Network Traffic in UniFi. These include:
- Traffic Inspector
- Client list with traffic statistics
- Deep Packet Inspection (DPI)
- Device statistics
- Real-Time Traffic View
- Traffic per VLAN
- Traffic per application category
- Traffic per interface
- Traffic per port (switch level)
Each tool has a different use case, so let’s walk through them one by one.
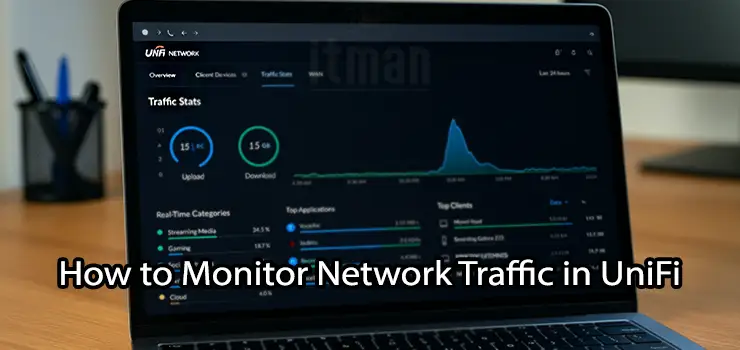
Using Traffic Inspector for High-Level Visibility
Traffic Inspector is the main dashboard used to Monitor Network Traffic in UniFi.
It provides an overview of traffic sorted by:
- Application category
- Specific application
- Source device
- Destination device
- Time period
- Protocol
- VLAN or network
For example, you can instantly see:
- YouTube consuming 37% of bandwidth
- Downloads from Steam spiking at 200 Mbps
- A single laptop saturating the uplink
- IPTV streams causing constant load
This data is extremely useful for capacity planning and troubleshooting “slow internet” reports.
Monitoring Per-Device Network Traffic in UniFi
If you want to see which devices consume the most traffic, go to Clients view.
For each device you can check:
- Tx/Rx throughput
- Cumulative data usage
- Application traffic categories
- Real-time bandwidth chart
- PHY rate and signal quality
- Network type (wireless or wired)
This helps you identify bandwidth hogs, which is especially useful in networks with shared resources.
Using Deep Packet Inspection (DPI) in UniFi
DPI is one of UniFi’s strongest features when it comes to traffic monitoring. When enabled, DPI classifies traffic into categories like:
- Streaming
- Gaming
- Social media
- VPN and tunneling
- Browsing
- Downloading
- VOIP
- P2P
This makes it easier to Monitor Network Traffic in UniFi because you get context, not just numbers.
Example problem scenarios DPI reveals:
- Users are streaming Netflix all day
- BitTorrent is consuming 40% of WAN bandwidth
- Spotify is running on 50 devices simultaneously
- Zoom meetings are congesting upload capacity
UniFi also allows you to block traffic categories based on DPI data, making it both an analytics and enforcement tool.
Real-Time Traffic Monitoring in UniFi
The Real-Time Traffic View is perfect for active troubleshooting. It shows:
- Live bandwidth consumption
- Top talking devices
- Top applications
- Traffic spikes
- Protocol usage
Technicians use it when they need fast answers to questions like:
- Why is the internet suddenly slow?
- Which device is spiking traffic?
- Is the ISP link saturated?
- Is there abnormal upload activity?
Real-time visibility can save hours of troubleshooting time.

Monitoring VLAN Traffic in UniFi
If your network uses VLAN segmentation, UniFi makes it easy to view traffic per VLAN.
This is useful for:
- Separating guest traffic from corporate networks
- Tracking IoT bandwidth usage
- Identifying rogue devices
- Monitoring CCTV or VoIP utilization
You can generate reports by VLAN to analyze usage patterns and scaling requirements.
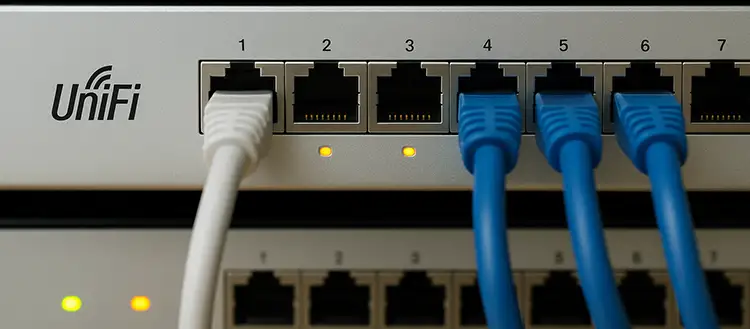
Monitoring Traffic on UniFi Switches
UniFi switches do not provide DPI, but they do expose helpful telemetry:
- Interface throughput
- Per-port bandwidth history
- Error counts
- PoE usage (if applicable)
- Connected device list
This helps diagnose issues such as:
- A specific port saturating a link
- Bad cable causing CRC errors
- Bottleneck on an uplink
- Misconfigured trunk or access port
Many administrators overlook switch statistics, but they are an essential part of monitoring.
Monitoring Traffic on UniFi Access Points
Access points provide additional metrics, including:
- Throughput
- PHY rate
- Airtime usage
- Retries
- Interference
- Client count
These metrics help pinpoint Wi-Fi performance problems.
For example:
- A 2.4 GHz AP nearing 80% airtime utilization
- Clients falling back to low PHY rates
- Noise floor spikes during business hours
- Congestion caused by too many devices
Wi-Fi troubleshooting without analytics is guesswork. UniFi simplifies it.
Monitoring Applications with Wi-Fi Experience Score
UniFi calculates a Wi-Fi Experience Score per device or per AP, based on:
• SNR
• PHY rate
• Retries
• Latency
• Connection stability
Although not directly tied to traffic volume, it is a great indicator of user experience problems caused by traffic congestion.
Low scores often correlate with traffic spikes.
How to Export Traffic Metrics and Reports in UniFi
UniFi allows exporting historical data for analysis, including:
• Traffic analytics
• Client lists
• Device summaries
• Usage per category
• Throughput graphs
This is useful for:
• Network audits
• Monthly reporting
• Capacity planning
• ISP negotiation
Exports are available in CSV and JSON formats.
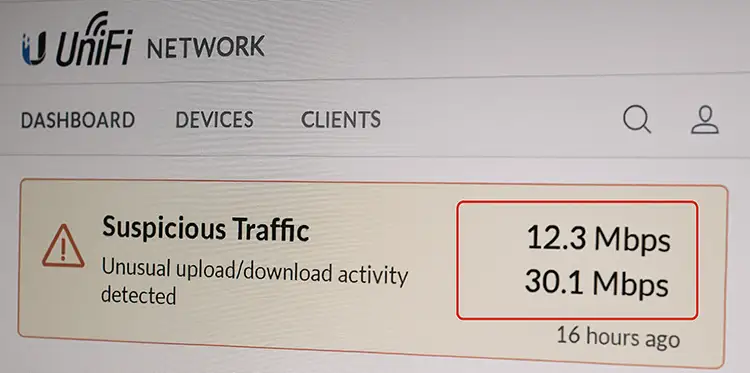
How to Detect Abnormal or Suspicious Traffic
Because UniFi exposes traffic by category, protocol, user, and device, it is possible to detect unusual patterns such as:
• Large outbound uploads
• Constant TCP SYN floods
• Unknown VPN usage
• Unexpected P2P or torrents
• High usage outside business hours
This is especially important for organizations without a dedicated security team.
Limitations of UniFi Traffic Monitoring
Although powerful, UniFi has limitations:
• DPI is CPU-intensive
• Requires UniFi gateway for full analytics
• Does not provide packet-level inspection
• L7 classification is not perfect
• No full NetFlow export
• Limited forensic visibility
UniFi is designed for practical visibility, not enterprise-grade surveillance.
Best Practices to Monitor Network Traffic in UniFi Effectively
To get the most accurate data and performance, follow these best practices:
- Use a supported UniFi gateway with enough capacity
- Enable DPI only if CPU performance allows
- Create VLAN separation for different user groups
- Use traffic shaping during peak hours
- Limit broadcast domains when possible
- Track uplink usage on switches
- Monitor AP airtime and channel usage
- Investigate repeated spikes or anomalies
The key to network monitoring is consistency, not emergency reaction.
Using Traffic Policies and Shaping in UniFi
Monitoring is only half the story. You can use the collected data to configure:
• Rate limits
• QoS
• App restrictions
• VLAN prioritization
• Guest rate limits
• Smart queues
Example policies:
• Limit guest network to 20 Mbps
• Prioritize VoIP traffic
• Block torrent/peer-to-peer
• Limit gaming outside business hours
Seeing data makes policy design easier and more effective.
Real-World Scenarios Where Monitoring Pays Off
Here are common problems solved using UniFi monitoring tools:
- Office experiencing lag because of constant YouTube streaming
- ISP uplink fully used due to Dropbox sync
- Wi-Fi signal issues caused by excessive retries
- Night-time data spikes caused by unauthorized VPN
- CCTV feed consuming more than expected bandwidth
Monitoring makes troubleshooting faster and less disruptive.
How to Monitor Network Traffic in UniFi Remotely
Because UniFi is cloud-managed, you can analyze traffic remotely using:
• UniFi Cloud
• UniFi Mobile app
• VPN to controller
• Remote SSH
This is extremely useful for MSPs, IT consultants, or multi-site businesses.
Future Trends in UniFi Traffic Analytics
Ubiquiti is evolving toward:
• AI-assisted detection
• Anomaly alerts
• Smart prioritization
• Automated QoS
• Real-time traffic prediction
Future versions may reduce the need for manual analysis entirely.
Final Thoughts
Learning how to Monitor Network Traffic in UniFi transforms the controller from a provisioning platform into a powerful diagnostic tool. Whether you’re trying to optimize user experience, solve application latency, or investigate suspicious activity, UniFi provides enough analytics to make informed decisions without expensive enterprise tools.
As networks become more wireless, more multi-tenant, and more demanding, visibility is not optional—it is the foundation of performance and security.